KR1 Megatrend Thesis
Peter Holsgrove
Head of Investor Relations
v1.0, October 2026
I. The Automation of Cognitive Work
A fifth of the world’s workforce is paid, above all, to think. Approximately 700 million knowledge workers globally spend their days problem-solving, analysing, and making reasoned decisions, and command a disproportionate share of the estimated $58 trillion in global labour income [1]. Until recently, many forms of complex knowledge work have been insulated from automation. Those barriers are now collapsing. The arrival of advanced, hyper-efficient Large Language Models (LLMs) and specialised hardware clears a path to running autonomous cognitive workflows on an industrial scale.
In November 2022, GPT-3.5-class benchmark performance cost $20 per million tokens. By October 2024, the cost had decreased to $0.07, a reduction of more than 280-fold. More recent research estimates that the cost of achieving a given level of performance across five primary AI benchmarks fell by approximately 47% per quarter, or 13-fold annually, since 2023 [2]. As inference costs fall towards the marginal cost of compute, the economic barrier to deploying autonomous agents disappears.
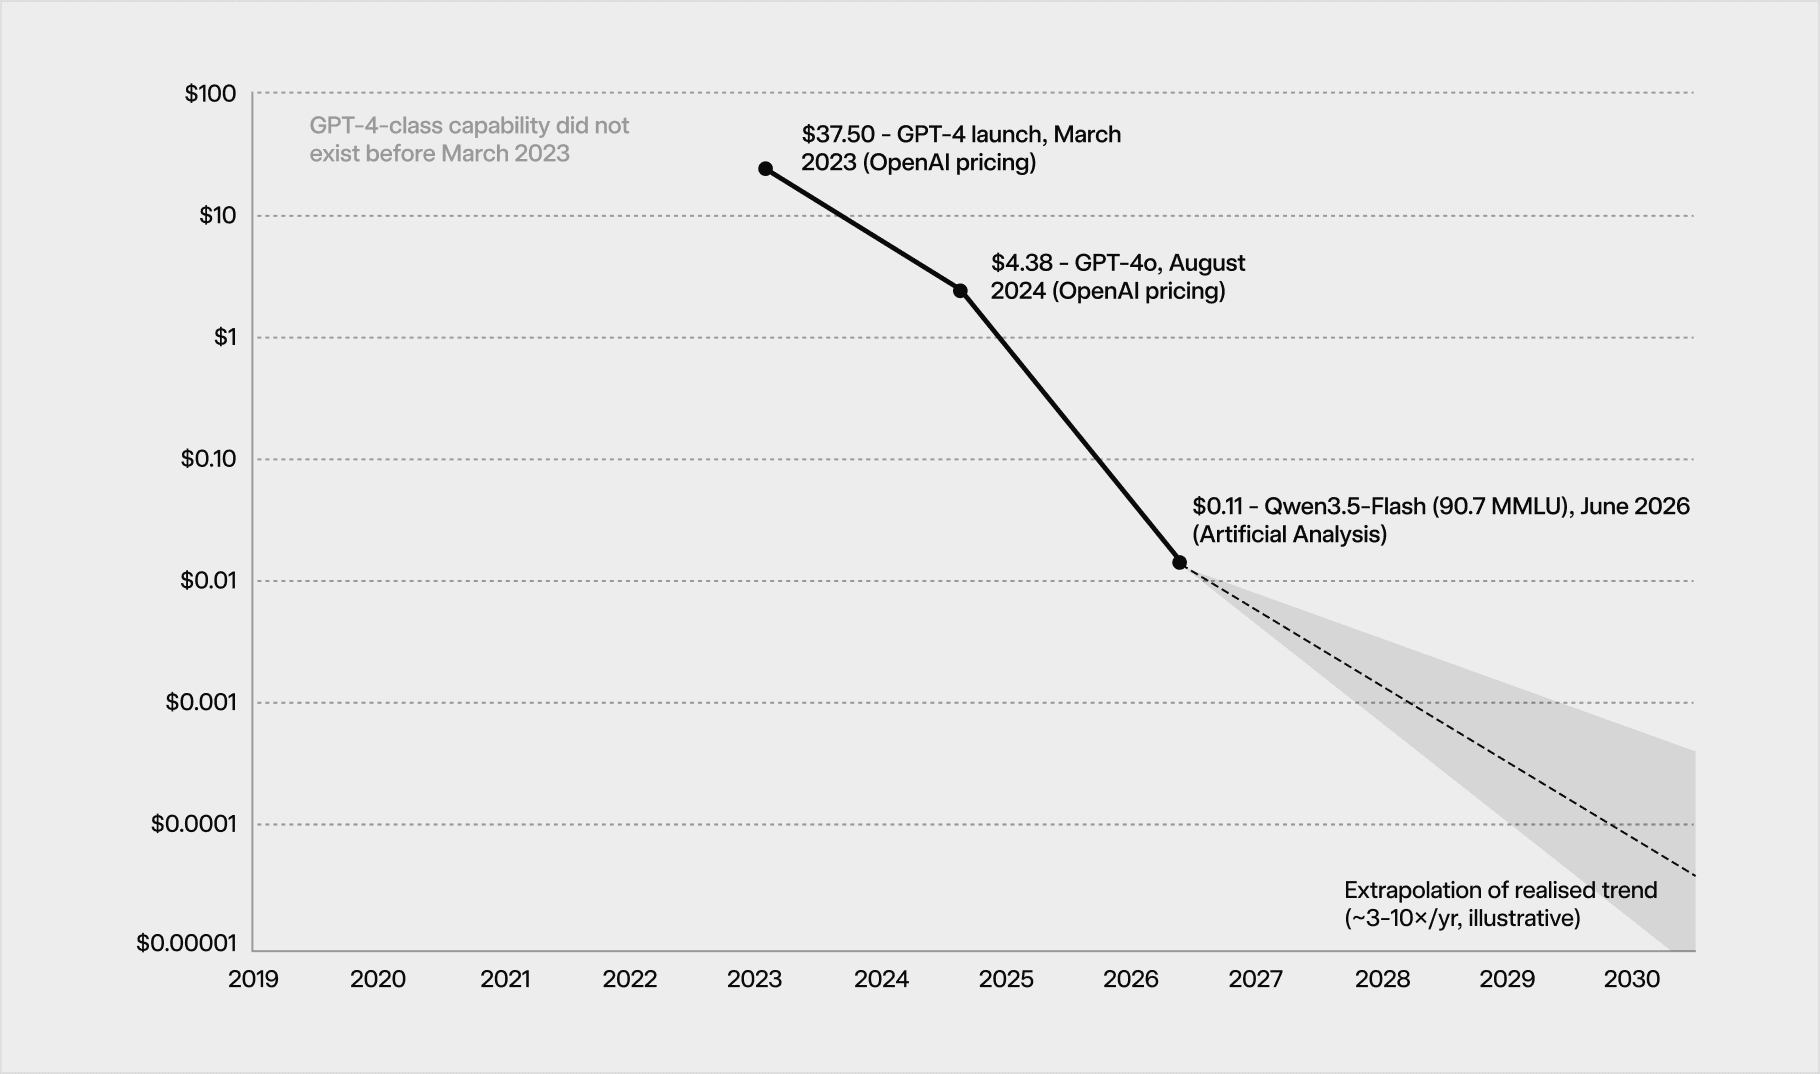
McKinsey’s November 2025 analysis found that currently demonstrated technologies could automate activities accounting for around 57% of US work hours: 44 percentage points through software agents performing non-physical tasks, and 13 through robotics [3]. The agent-addressable share represents roughly two-thirds of non-physical work hours. Applying this proportion to the global knowledge-worker population, and assuming one recurring workflow per worker-equivalent, gives an addressable pool of approximately 450 million workflows [1][3]. These are estimates based on what existing technology can already do. Our base case assumes 20% penetration of this pool by 2030, approximately 90 million agent-mediated workflows, with four in five addressable workflows remaining outside agent-mediated execution. A mid-band case at 30% penetration implies 135 million workflows, while the aggressive case, at 40%, reaches approximately 180 million over the same period.
II. Assets Become Programmable
If the first trendline charts the declining cost of intelligence, the second charts the expanding universe of assets that intelligence can act upon. Stablecoin transfer volume, the first and largest wave of asset tokenisation, crossed the $1 trillion milestone in 2020 and expanded to $33 trillion by 2025, with filtered estimates ranging from approximately $10.2 trillion to $26 trillion. By transferred value, stablecoins now settle within the same order of magnitude as the combined volume of Visa and Mastercard, two of the world’s largest card payment networks [4].
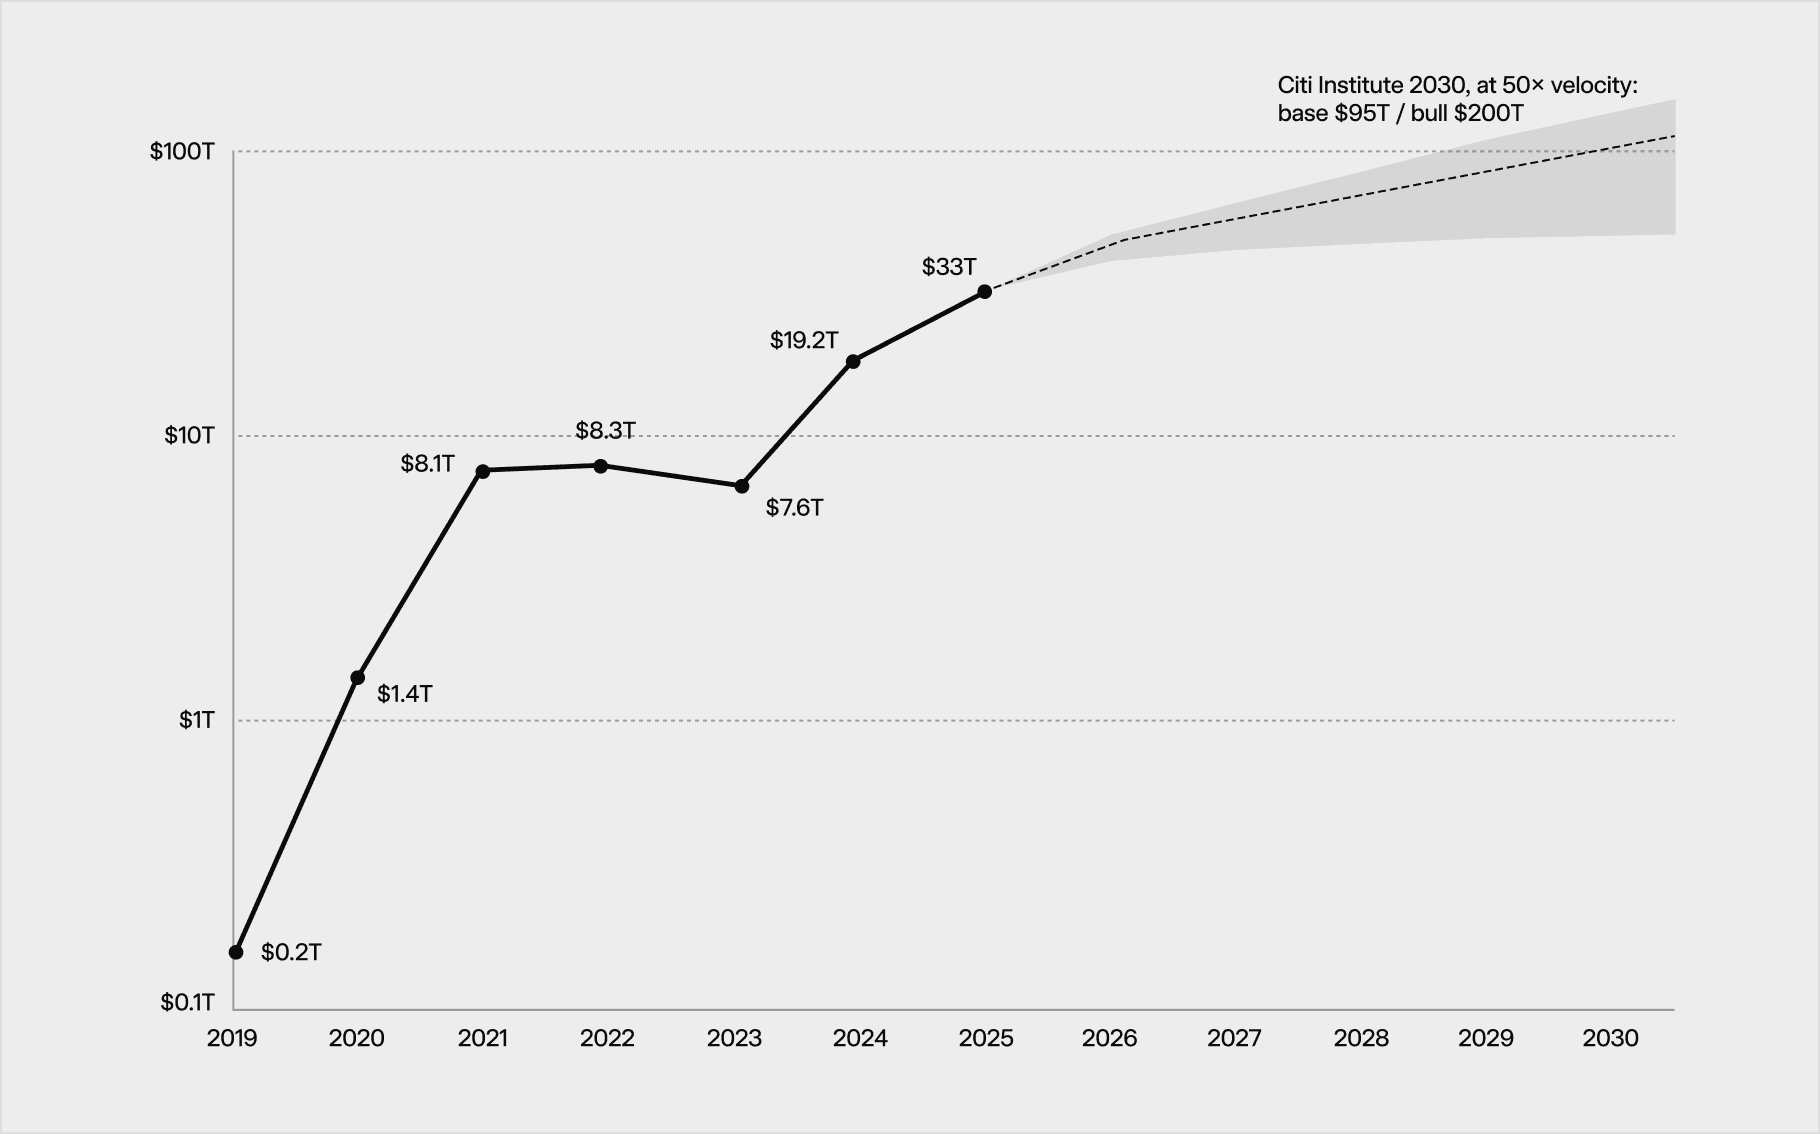
Stablecoins have likely activated a process that will see the large majority of tradable assets migrate onchain. In this context, Stewart Brand’s much-quoted maxim, “information wants to be free”, could predictably be appended with a second clause: and value wants to be transferable. Through a similar process to the one that saw the internet liberate information into a global stream of always-on, always-available consumption, permissionless blockchains built on internet rails will do the same for assets. For the same reason it is now inconceivable to need to buy a newspaper to read the day’s headline, it will likely be absurd to think of an asset that changes hands in days rather than seconds, through a chain of intermediaries each keeping a separate record of it.
The wider market for tokenised assets, excluding stablecoins, reached approximately $46.2 billion in October 2026 [5]. Seven asset categories each exceed a billion dollars: US Treasury bills, gold, credit funds, onchain yield strategies, energy, venture and private equity funds, and real estate. Traditional finance is arriving at scale onchain, alongside an expanding universe of onchain-native investment products. BlackRock, Franklin Templeton, JPMorgan, Circle and Ondo now offer tokenised products. Across the market, instruments classified as tokenised funds account for $34.6 billion, or approximately 75%, of total value [5].
III. Intelligence as Software Meets Assets as Software
The collapsing cost of intelligence and the rise of asset tokenisation converge on a structural bottleneck: while autonomous agents are now economically viable at scale, they lack a native financial substrate on which to transact. Existing infrastructure for coordinating value exchange remains irrevocably tethered to a human-in-the-loop archetype. Autonomous agents, operating at machine speed across jurisdictions, demand systems fundamentally orchestrated for software, enabling them to independently originate, transfer, and settle economic value.
The emergence of autonomous AI represents the second great chapter of economic agency. The defining characteristic of any economic agent—its capacity to error-correct, adapt, and compound progress—scales proportionately with the diversity of environments it can explore and the network of peers with which it can collaborate. Much as central planning stifles human ingenuity by artificially restricting the surface area of market interactions, closed financial networks will intrinsically constrain the problem-solving capabilities of agentic systems. To scale an agent-driven economy, the underlying economic rails must guarantee open, permissionless access. Agents require a credibly neutral environment that underwrites collaboration at machine speed, substituting institutional trust with cryptographic finality.
A common counterargument assumes that permissionless networks are superfluous for agent settlement. Closed alternatives bypass the coordination costs inherent to decentralisation, and agent-driven payments can theoretically operate via delegated human authority on traditional rails. In this view, a corporate AI paying a pre-vetted vendor does not necessitate a public coordination layer; it merely requires a spending limit, an audit log, and human oversight for dispute resolution. However, the exact features that secure closed infrastructure for legacy finance render it structurally unworkable as a global agentic substrate. Closed networks function by tethering identity and finality to rigid bureaucratic processes. Trust is not embedded within the technology; rather, it is inherited from a consortium of vetted institutions underwriting one another. To transact, any new participant must satisfy established eligibility criteria and execute legal agreements recognised by the network. Autonomous software, lacking a bank account, a physical jurisdiction, or the juridical personhood required to become a recognised entity, exists entirely outside this legacy framework. It is at this boundary that an open, permissionless substrate transitions from a theoretical ideal to a functional mandate.
IV. Demand Model
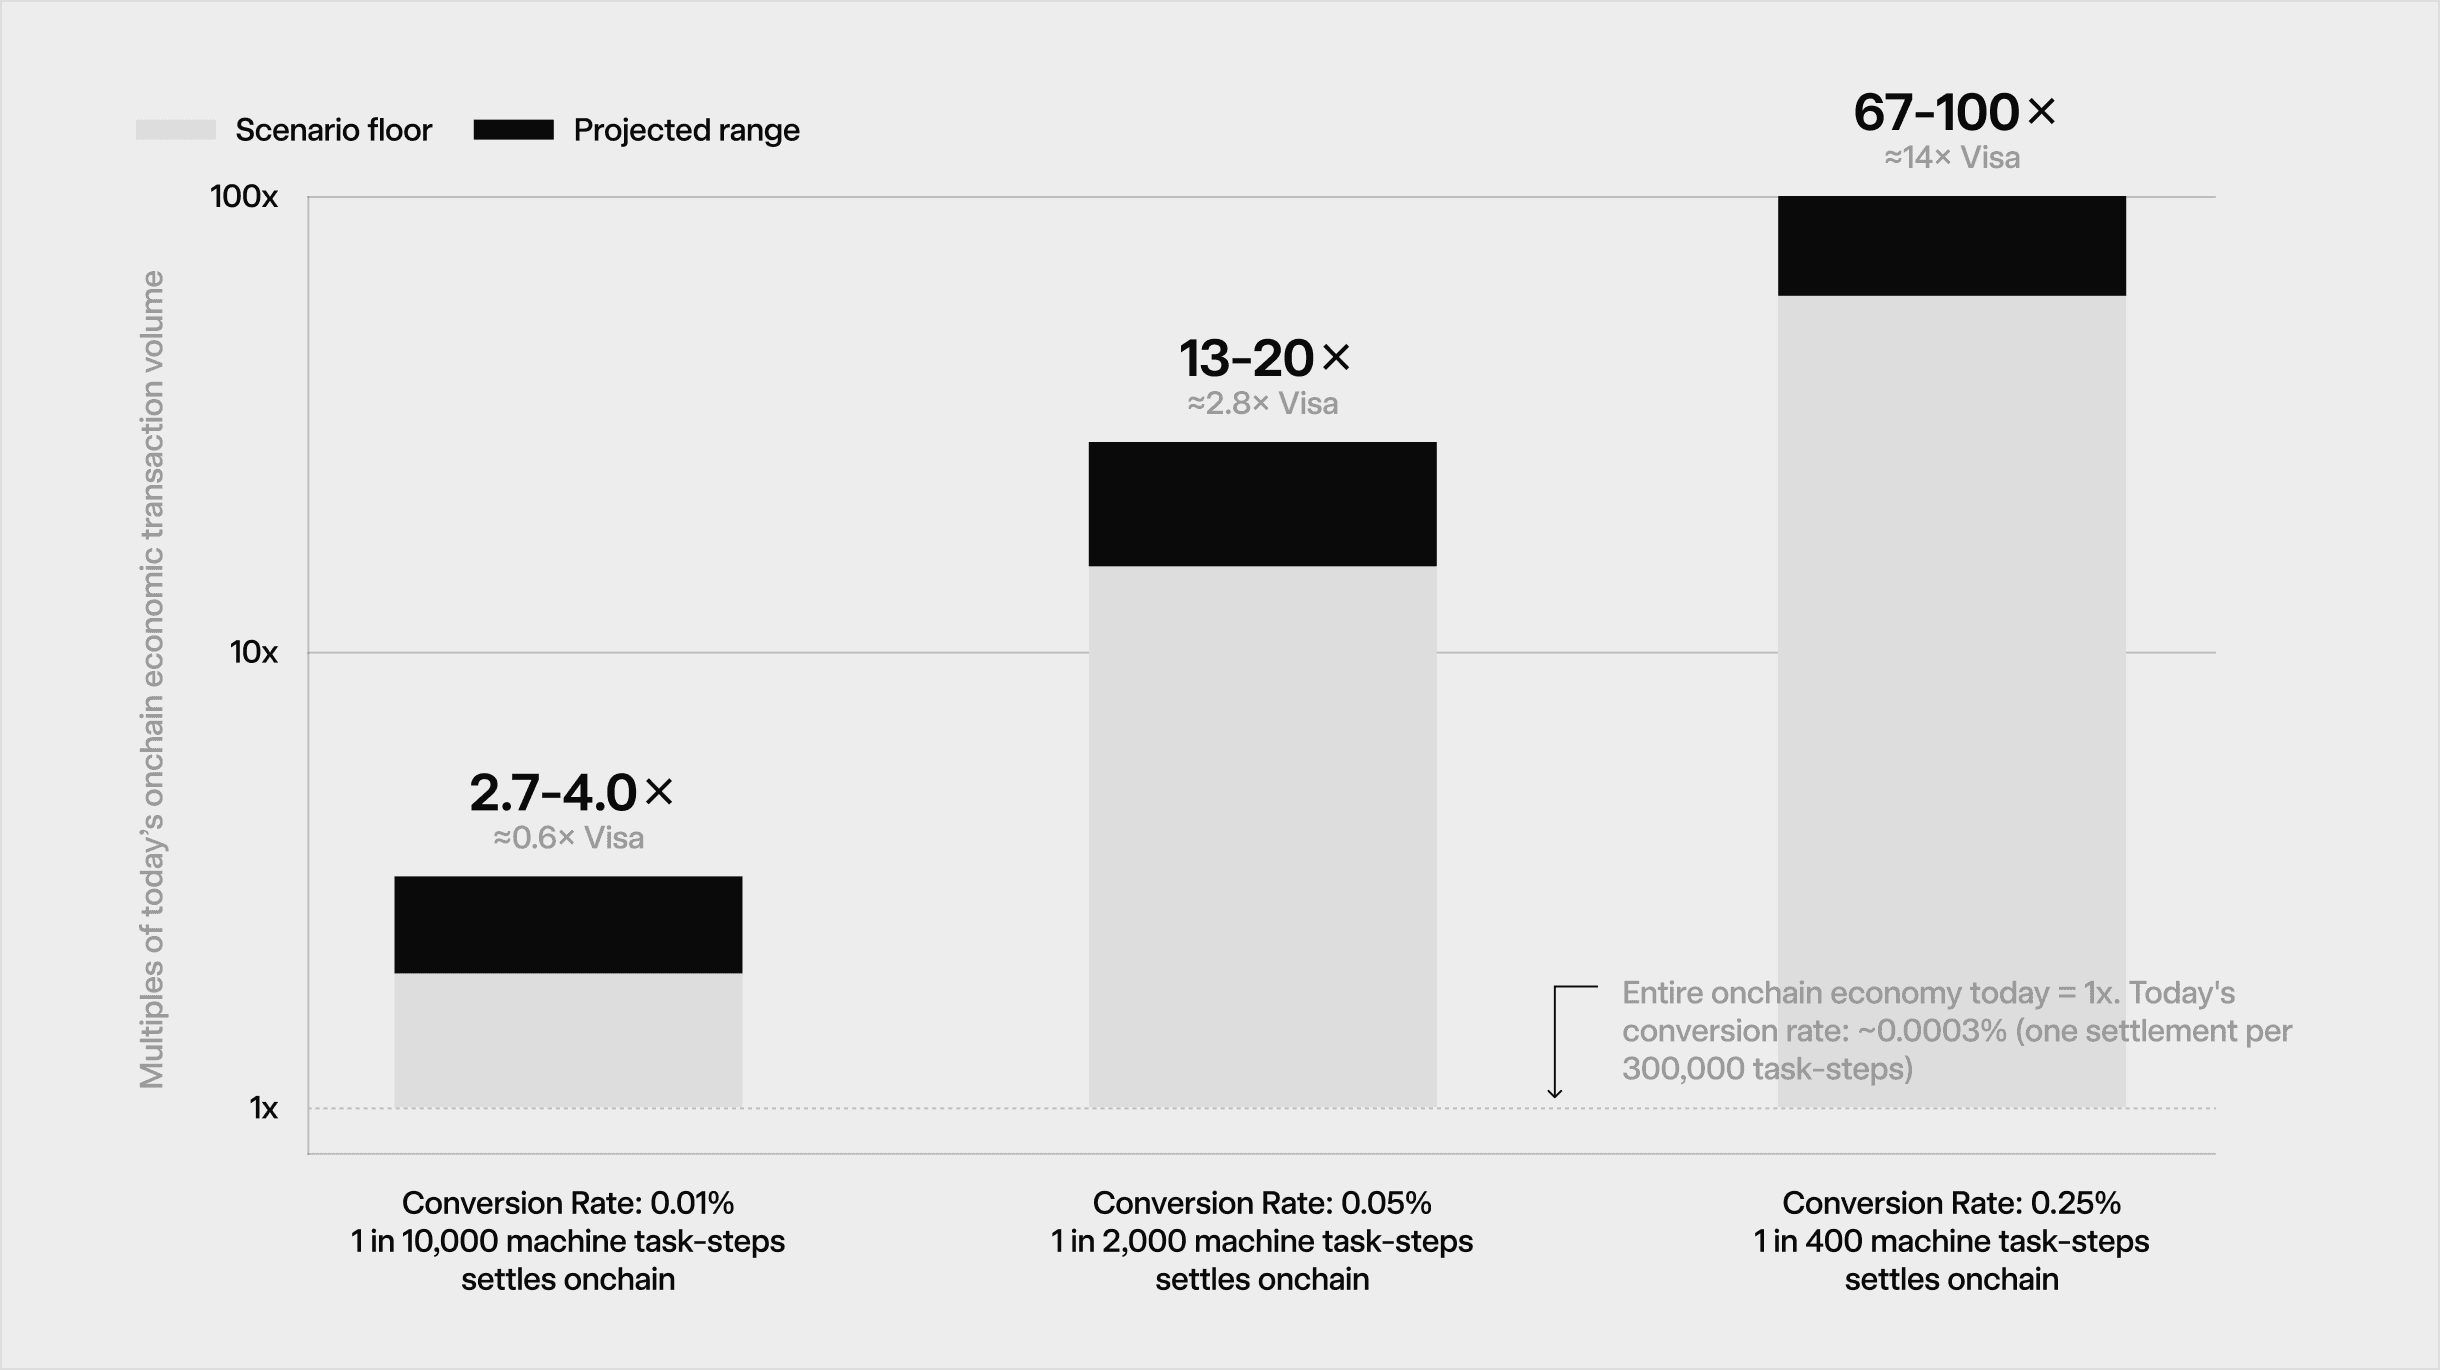
We size the potential onchain AI economy from the volume of work migrating to machine cognition, and the rate at which that cognition converts into settlement on public infrastructure. Institutional research projects global token consumption reaching 120 quadrillion tokens per month by 2030, or approximately 4 quadrillion tokens per day [6]. At an assumed 1,000 tokens per task-step equivalent (see methodology note), this represents roughly 4 trillion machine task-step equivalents per day, where a small fraction crosses an external trust boundary and settles on public rails. We call the share of task-steps that results in a public onchain transaction the conversion rate.
The forecast’s implied 2026 baseline equates to roughly 170 billion task-step equivalents per day [6]. Meanwhile, Coinbase reported more than 160 million x402 payments over the year preceding June 2026, equivalent to roughly 440,000 payments per day [7]. These figures suggest an indicative historical conversion rate on the order of 0.0003% [6][7]. Our thesis holds that this rate will rise by orders of magnitude as agents mature from internal enterprise tools into cross-boundary economic actors.
| Forecast Scenario | Conversion Rate | Daily Vol. (Transactions) | Annualised Vol. (Transactions) | Versus Today’s Onchain Economy | Versus Visa Network |
|---|---|---|---|---|---|
| Conservative | 0.01% | 0.4 Billion | 146 Billion | 2.7-4.0× | 0.57× |
| Central | 0.05% | 2.0 Billion | 730 Billion | 13-20× | 2.8× |
| Aggressive | 0.25% | 10.0 Billion | 3.65 Trillion | 67-100× | 14.2× |
Ranges reflect the 100-150m/day onchain transaction baseline.
We estimate transaction activity across major Layer 1 and Layer 2 networks at approximately 100-150 million transactions per day, or 37-55 billion on an annualised basis [8]. Each rising-conversion scenario above implies agent-attributed settlement at multiples of this onchain transaction baseline.
Section I’s workflow framework provides a second route to the same question, reasoning from workforce inputs rather than token consumption. The base case assumes 90 million active workflows executing 50 daily tasks, with 15% resulting in a public onchain transaction, implying approximately 246 billion annualised transactions.
The aggressive case assumes 180 million workflows executing 200 daily tasks, with 25% resulting in a public onchain transaction, implying approximately 3.3 trillion. Both calculations assume one onchain transaction per qualifying task. Expressed against the same token-consumption anchor, these imply conversion rates of approximately 0.02% and 0.23%, within the scenario corridor above.
Treating the conversion rate (c) as a single macro variable is useful for sizing demand, but insufficient for evaluating how economic density accrues to onchain infrastructure. Broadly, autonomous agents must generate external economic intent; that intent must route to public networks and the onchain infrastructure network or protocol must durably monetise that workload. Finally, the asset must route that captured value to token holders. Because the macro conversion rate governs only the top of this funnel, reasoning with where value concentrates requires further downstream analysis.
We maintain the conversion rate as our conceptual anchor and track three reproducible, onchain proxies:
- The Settlement Floor: The transaction value settling over known, dedicated agent infrastructure (such as the x402 protocol and registered agent wallets) as a share of total stablecoin settlement. This is a consistently constructed floor, where the trend is informative even if the absolute level is a severe undercount.
- Adoption Momentum: A composite directional indicator tracking agent-compatible wallet growth, transaction velocity, and counterparty depth to confirm structural adoption across key networks.
- Instrument-Level Value Capture: The specific fee flows—such as burned supply or revenue-funded distributions—connecting protocol throughput directly to token accrual.
We publish the reasoning and framework in the spirit that all models are wrong, but some are useful. Our principal interest is in the direction and magnitude of adoption. We expect to update against the realised conversion rate as machine-transaction telemetry matures.
V. The Shape of Agent Demand
Agentic transaction demand is not uniform. The value an autonomous agent brings to public infrastructure is dictated by two fundamental properties: Cognition Intensity (the ratio of reasoning steps to onchain settlements) and Value per Settlement (the fee generated per transaction). Mapping agents across these two dimensions reveals distinct demand profiles, which in turn indicate which infrastructure layers capture demand.
Archetype A: High-Value SettlementHigh Cognition, High Value
- Discrete, high-stakes transactions where an agent exercises heavy judgement before committing (e.g., procurement, negotiated counterparties, settling material obligations). This profile yields low throughput but high per-unit economic value, requiring cryptographic finality, legal-grade attestation, and compliant identity rails. Volume weight: 6% | Value weight: 28.5%. Primary layers: Settlement, Identity.
Archetype B: High-Frequency CoordinationHigh Cognition, Low Value
- Reasoning agents continuously purchasing data, compute, tool access, and APIs as a by-product of their workflows. This generates the vast majority of transaction volume at micropayment economics, demanding hyper-scalable throughput and sub-second latency. Volume weight: 82% | Value weight: 43%. Primary layers: Settlement, Data Availability, Coordination.
Archetype C: Continuous State OptimisationLow Cognition, High Value
- Proactive, closed-loop automation monitoring an onchain target state (yield, collateral health, liquidity) and executing the minimum transactions needed to maintain equilibrium. Because it is deterministic rather than deliberative, cognition intensity can be low, but extreme reliance on external state data makes it asymmetrically dependent on robust data feeds. Volume weight: 12% | Value weight: 28.5%. Primary layers: Oracles, Settlement.
The Verification OverlayCompute-Intensive Workloads
- Agent workflows using offchain computation to inform onchain actions. Where counterparties require assurance before execution, these workflows create demand for verifiable inference, proof generation and privacy-preserving compute. Demand scales with computational complexity, assurance requirements and economic stakes. Indicative overlay exposure: 15% of transaction volume | 30% of settlement value. Included within archetypes A-C. Primary layers: Decentralised Compute, Privacy-Preserving Inference, Verifiable Compute.
Beneath these archetypes lies a baseline of low-cognition, low-value machine traffic: basic MEV searchers, automated keepers, and simple sensor bots. This traffic generates real fees and consumes blockspace, but primarily executes predefined rules with limited model-based reasoning. It forms part of the existing onchain economy against which we compare agentic demand.
This distinction shapes how we read early telemetry. Frequent, publicly visible automation is easier to observe than agent activity involving proprietary strategies or private commercial decisions, particularly within Archetype A. We therefore expect the high-frequency coordination of Archetype B to provide an early, visible signal of agentic adoption. The signal is an expanding share of transactions attributable to reasoning agents purchasing data, compute and services, alongside the existing automation baseline. This anticipated pattern is why our framework prioritises structural, directional momentum when interpreting absolute transaction levels.
| Infrastructure Layer | Index Weight | Primary Demand Driver | Rationale |
|---|---|---|---|
| Settlement | 35% | Archetypes A, B, C | Universal dependency across all archetypes with proven paid-demand models. |
| Oracle/Data Feeds | 20% | Archetype C | Critical infrastructure for deterministic, high-value automated loops. |
| Data Availability | 15% | Archetype B | Essential for scaling, though highly sensitive to fee compression. |
| Decentralised Compute | 12% | Verification Overlay | Captures value only when trustless, onchain proof of offchain reasoning is required. |
| Coordination / Payment | 10% | Archetype B | Handles the hyper-granular micropayment economics of continuous agent coordination. |
| Identity | 5% | Archetype A | Indispensable for material transactions, but structurally difficult to monetise. |
| Privacy Inference | 3% | Verification Overlay | Niche but necessary for high-cognition agents operating over proprietary data. |
These exposure weights define the KR1 Onchain Infrastructure Index, establishing our neutral allocation across infrastructure layers and informing forward analysis. The index serves as a strategic demand map and weighted judgement about where demand will cluster. KR1 expresses this framework through Soren, a proprietary sourcing, diligence and monitoring engine. Soren enforces objectivity through automated sequencing, an append-only analytical log and governance cadences. Additionally, Soren separates strategic investments and allocation into two distinct reporting bases: assets held for accrual (generating proven, measurable holder revenue today) and assets held for conversion (where structural value-routing mechanisms are live, but fee flows are pending the arrival of agentic demand).
VI. The Onchain Economy
We believe a new economy is forming at the convergence of abundant intelligence, the cost of machine cognition falling by severalfold each year, and assets expressed as software, with stablecoin settlement now running in the tens of trillions of dollars annually and tokenisation extending the same properties across the asset spectrum. The demand model above establishes the scale and the direction of travel: agentic settlement arriving at multiples of today’s entire onchain economy, clustering in the infrastructure layers mapped in Section VI. For public-market investors, KR1 carries concentrated, operational exposure to the infrastructure beneath this convergence in a single listed equity. The thesis is written against observable measures of how the agentic economy takes shape onchain and, above all, the rate at which machine cognition converts into transactions on the open, permissionless and programmable networks that underpin the onchain economy.